Transforming complex information into clear, engaging visuals has been a key part of my work across sports, marketing, and internal communications. From broadcast graphics and sponsor presentations to educational infographics and performance reports, my goal is always the same: make data easier to understand, more visually compelling, and meaningful for the audience it’s intended for.
These projects combine visual storytelling, hierarchy, branding, and strategic communication to turn raw numbers and processes into accessible visual experiences.
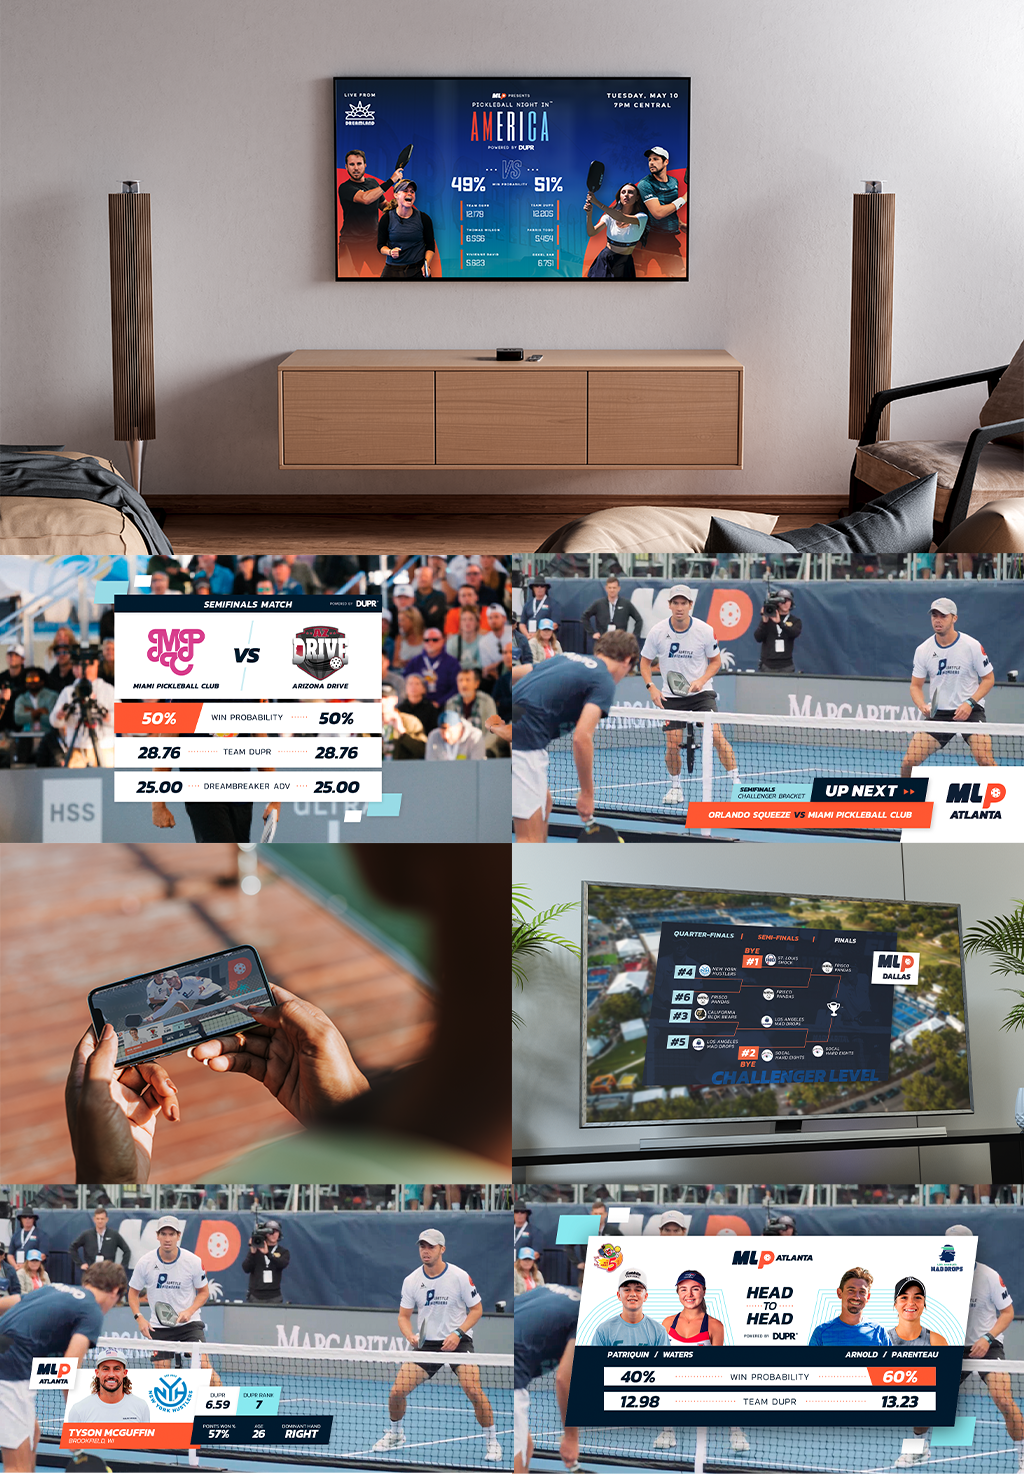
MLP Pickleball Broadcast Graphics — 2025
For the 2025 Major League Pickleball season, I worked on broadcast-focused data graphics designed to support live storytelling during matches and tournament coverage. These visuals translated player stats, rankings, match performance, and league information into dynamic on-screen graphics optimized for fast readability and audience engagement in a live sports environment.
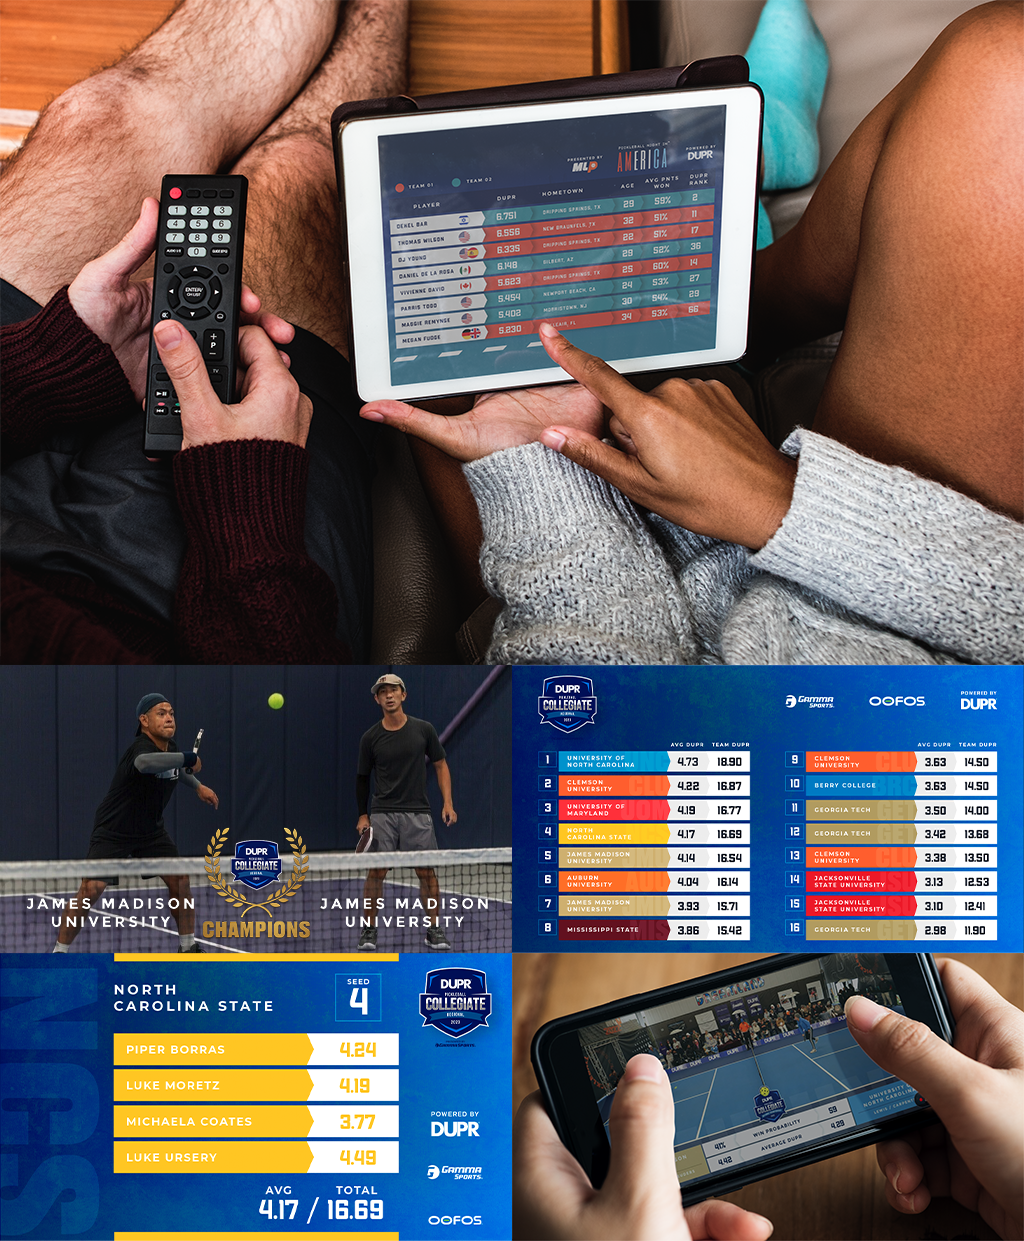
DUPR Pickleball League Graphics — 2023
For DUPR’s 2023 pickleball league coverage, I developed data-driven visual assets focused on player ratings, rankings, and competitive insights. The goal was to create clean and modern graphics that could communicate performance metrics while maintaining a visually engaging broadcast identity aligned with the league’s branding.
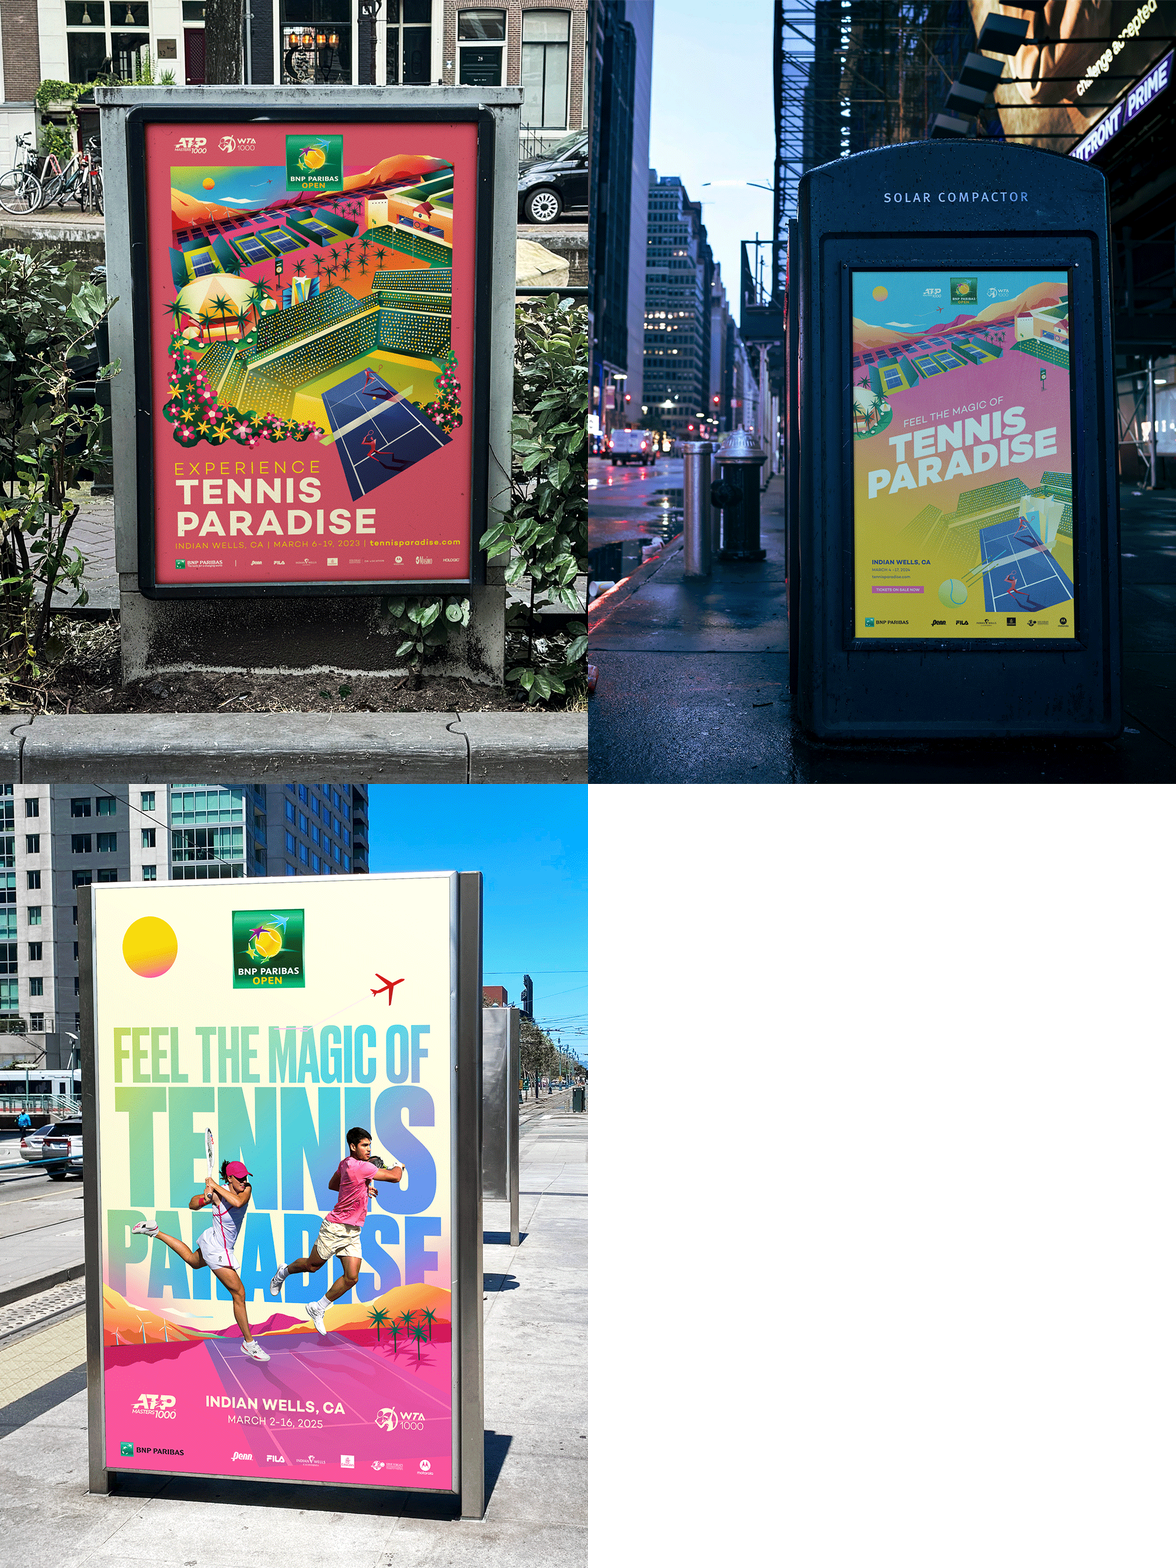
BNP Paribas Open — Sponsor & Year-End Presentations
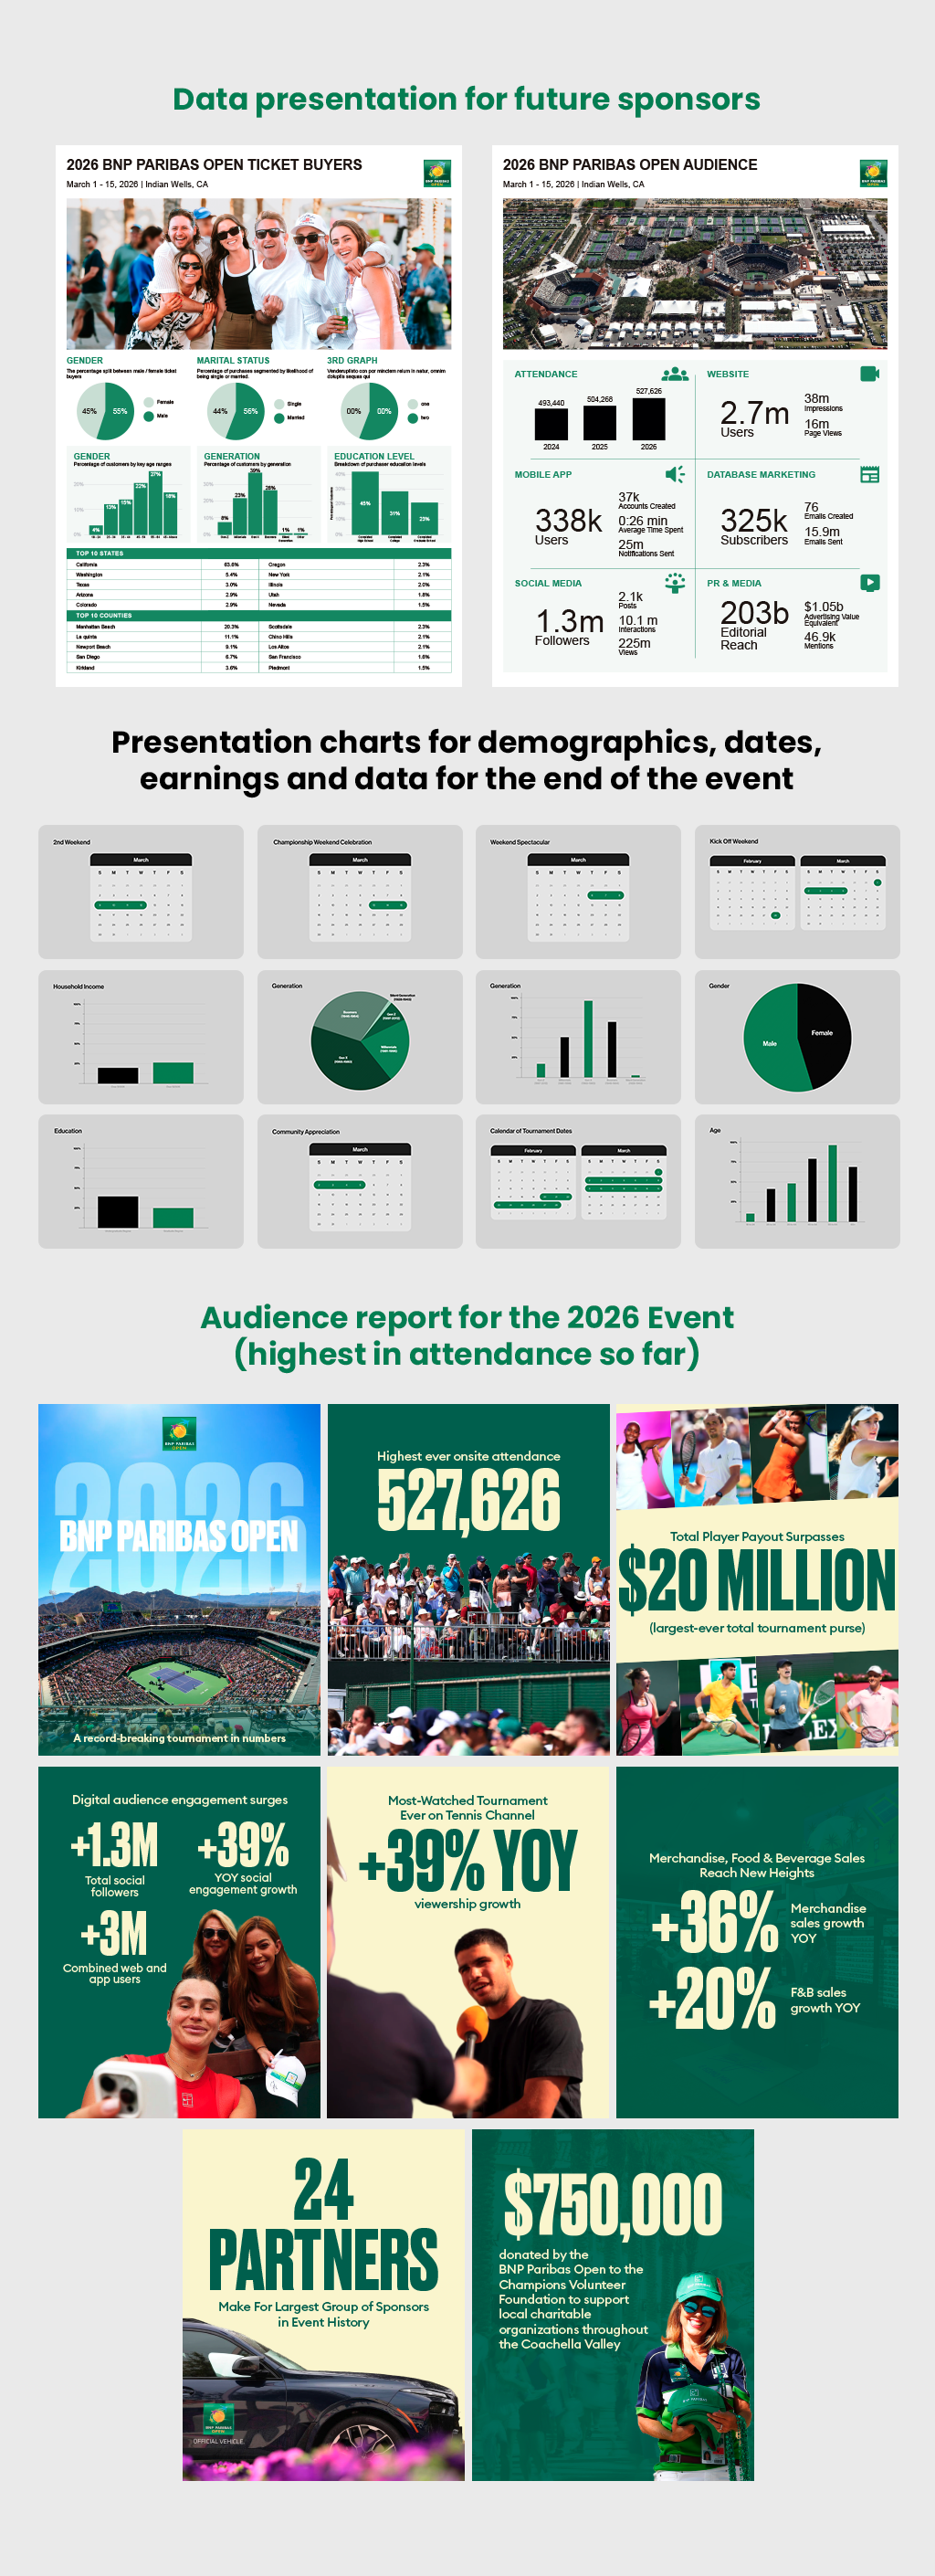
As part of the BNP Paribas Open marketing and presentation materials, I designed data visualizations and presentation graphics used to communicate sponsorship performance, audience reach, campaign metrics, and annual results. These presentations helped transform analytical reports into visually digestible narratives tailored for stakeholders and brand partners.
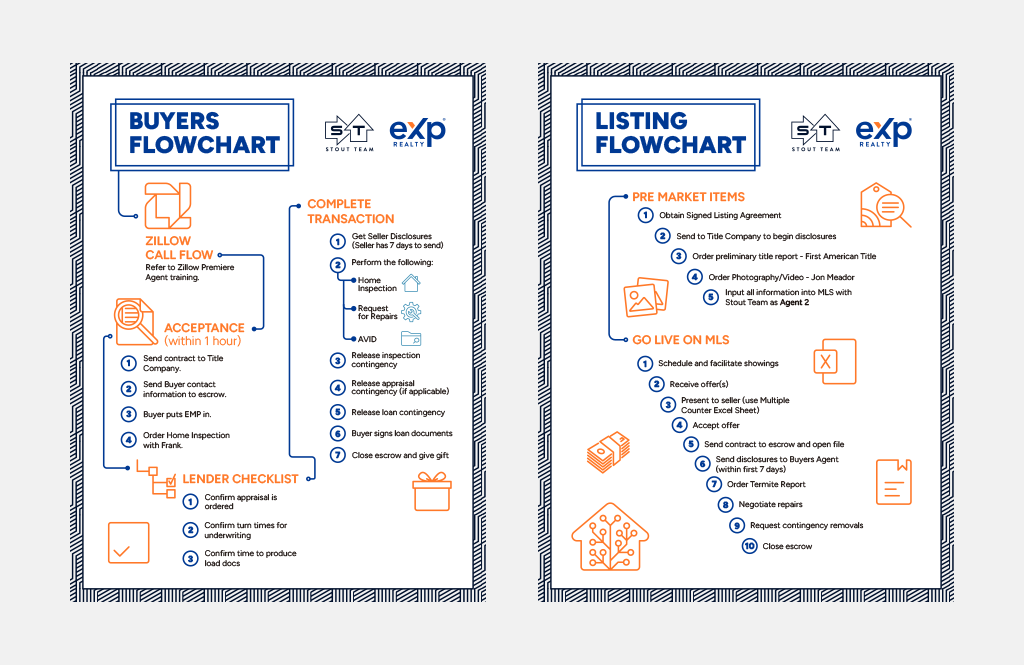
STT — Buyer & Seller Educational Infographics
For STT, I created infographic systems and process visualization materials designed to help onboard and educate new employees. One of the key pieces included a Buyer & Seller chart that simplified internal workflows, responsibilities, and operational relationships through intuitive layouts and structured visual communication.